So this is a lot of in-the-weeds stuff and a lot of "come to my seminar" but there's a few important takeaways.
1) the Phillips Curve is the economic relationship between unemployment and inflation, and the correlation most monitored by the Federal Reserve to set rates.
2) The way we measure unemployment changed in 2010.
3) Garbage in, garbage out.
Unemployment is calculated via a panel survey of 800 families, not from actual economic data. How 800 people answer these questions every week gives you the unemployment rate - and to be unemployed, you must be available to work now (not sick, not taking care of family, not parenting, not in school) and have sent out resumes in the past four weeks. If you:
- believe no job is available to you in their line of work or area
have previously been unable to find work
lack the necessary schooling, training, skills, or experience
Employers think you are too young or too old, or
Face some other type of discrimination
you are not counted as unemployed. Instead, you are a "discouraged worker."
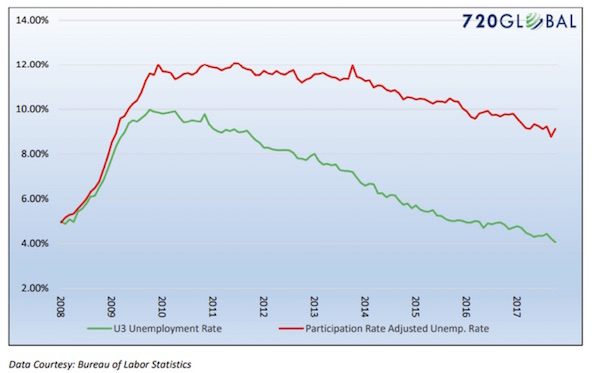
That's one way to get to 3% unemployment. What happens if you add "discouraged workers" to the unemployment rate?
'k great. So that Phillips curve... what happens when you compare official vs. corrected numbers?
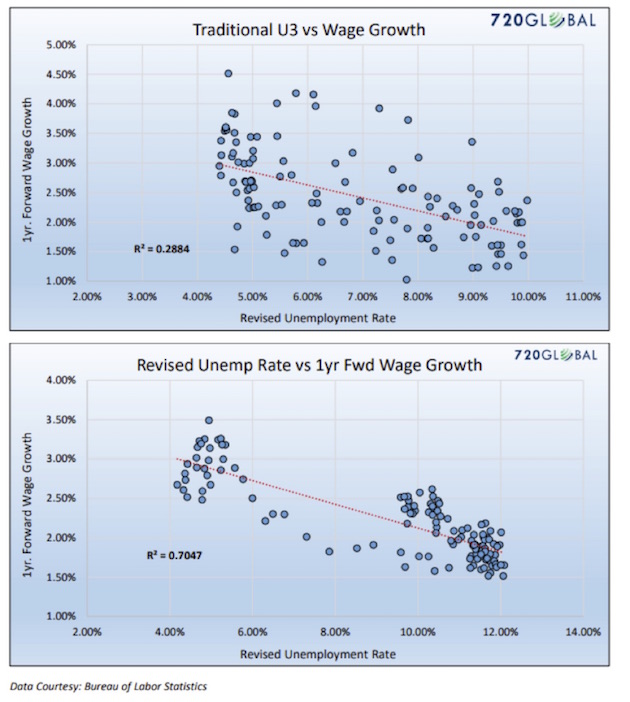
IF the Phillips Curve is a useful statistical correlation
THEN the correlation indicates real unemployment is about 9.5%.
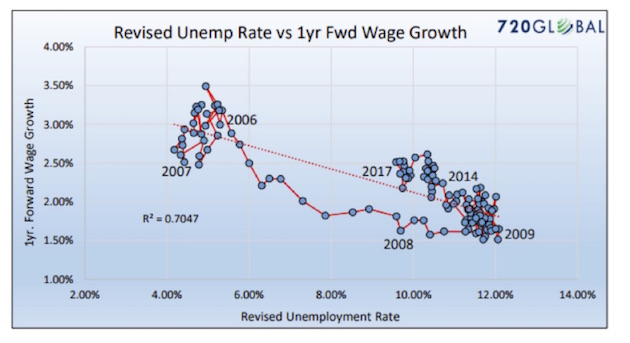
Also interesting looking at the clustering from 2006-2007 and the clustering from 2009-2017. It's almost like wage growth was being influenced by external factors.
Economic policy is about to be set on the assumption that the United States has achieved "full employment" (97%). Economic reality does not match policy.

posted 2253 days ago